Bitcoin price action & predicting future trends
Alt coins can go up 200% and back down as much or more in a blink of an eye which is quite breathtaking if you aren’t used to it. This can be a two edge sword for traders. Bitcoin’s price action is obviously volatile so how does a person figure out when to get in or run for the hills?
Bitcoin price action is the basis for technical analysis in crypto using charts plotted over time to find trends so we can make better trading decisions.
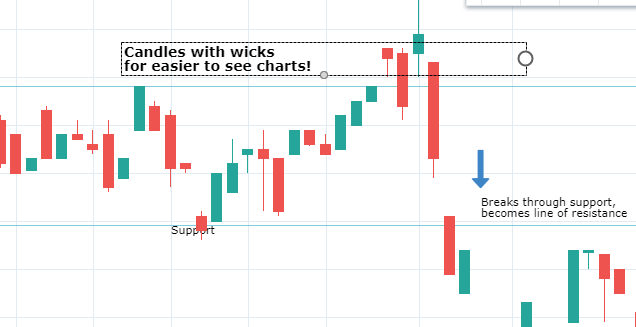
I have found that the more basic the charts,
the easier it is to follow. Using
candles is a good way to plot and forecast. These are the green and red columns that plot buying or selling pressure during a given time period.
This market takes courage and perspective, meaning HUGE wins or losses won’t affect you too much emotionally. Emotional traders lose while those with a plan who can objectively buy low and sell high have better prospects for winning.
I can’t speak for individual investments, but in general investing 1 to 5% of an investment portfolio is plenty for crypto and can help you sleep peacefully at night. Otherwise this market may not be for you…
Price action involves simplifying your charts and taking an educated guess where the market is going in the future by using data from the past. Its also good to have an idea when the smart money (large investors) are investing.
following the smart money
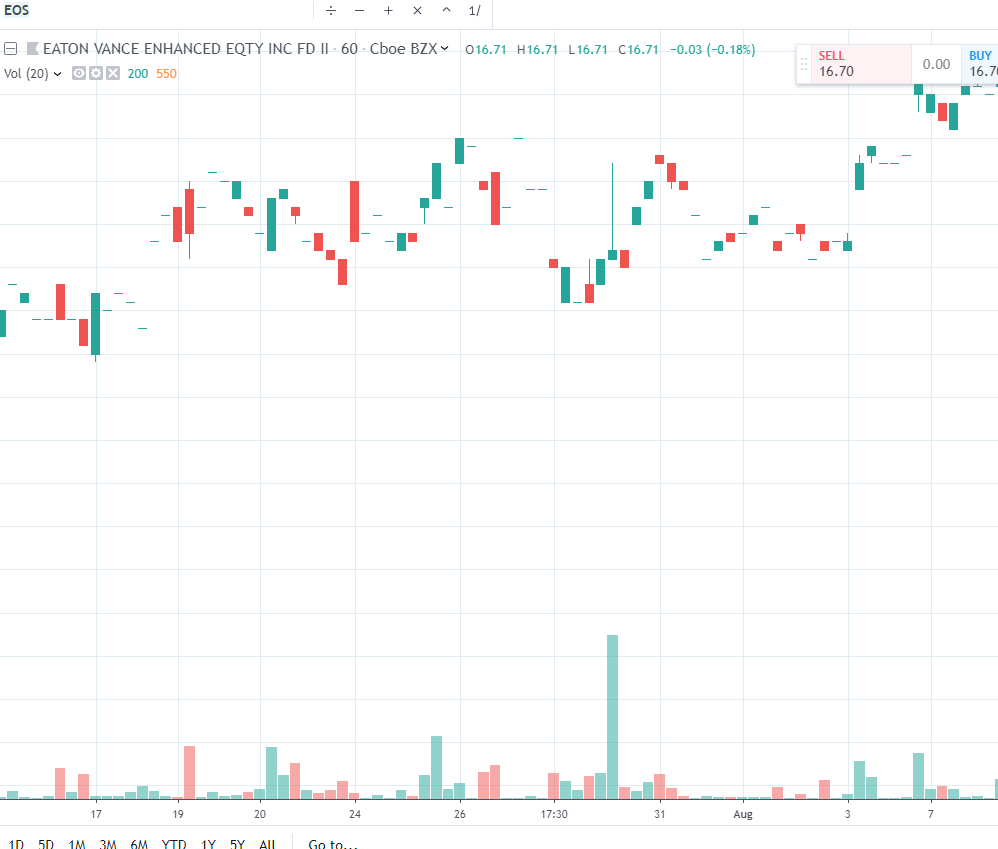
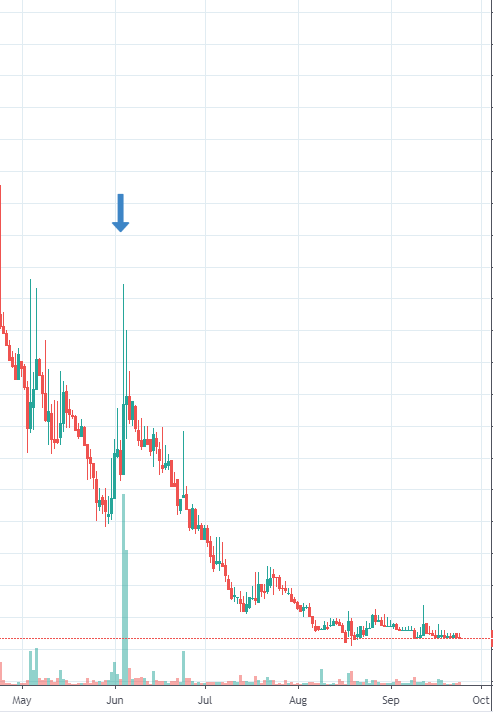
Volume along with price action can also be a very important tool to use. If a big trader decides to buy and there is really no price jump to be seen then there is a good chance this is accumulation before an uptrend. Looking closer you can tell that this lonesome buy was pretty much one trade and the price stayed within range.
The next chart shows 4 months later that the upswing began in EOS. Following the smart money is another good tool to trade and accumulate in this market.
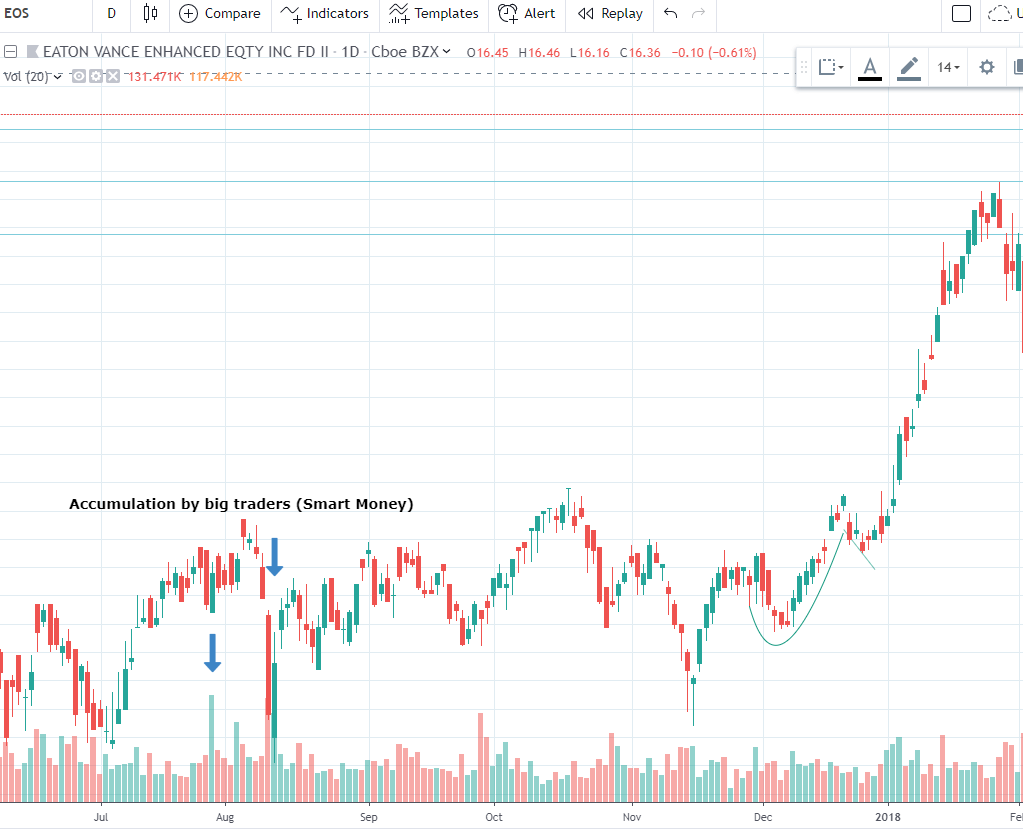
Here is a coin that had a big buyer yet the price kept heading down. Not a perfect art for sure, but you can see that this would be a coin to keep your eye on as smart money may be waiting for the upswing.
I don’t want anyone to get the idea that this a perfect science. We have tools to work with and we need to use them all in order to get the best information possible.
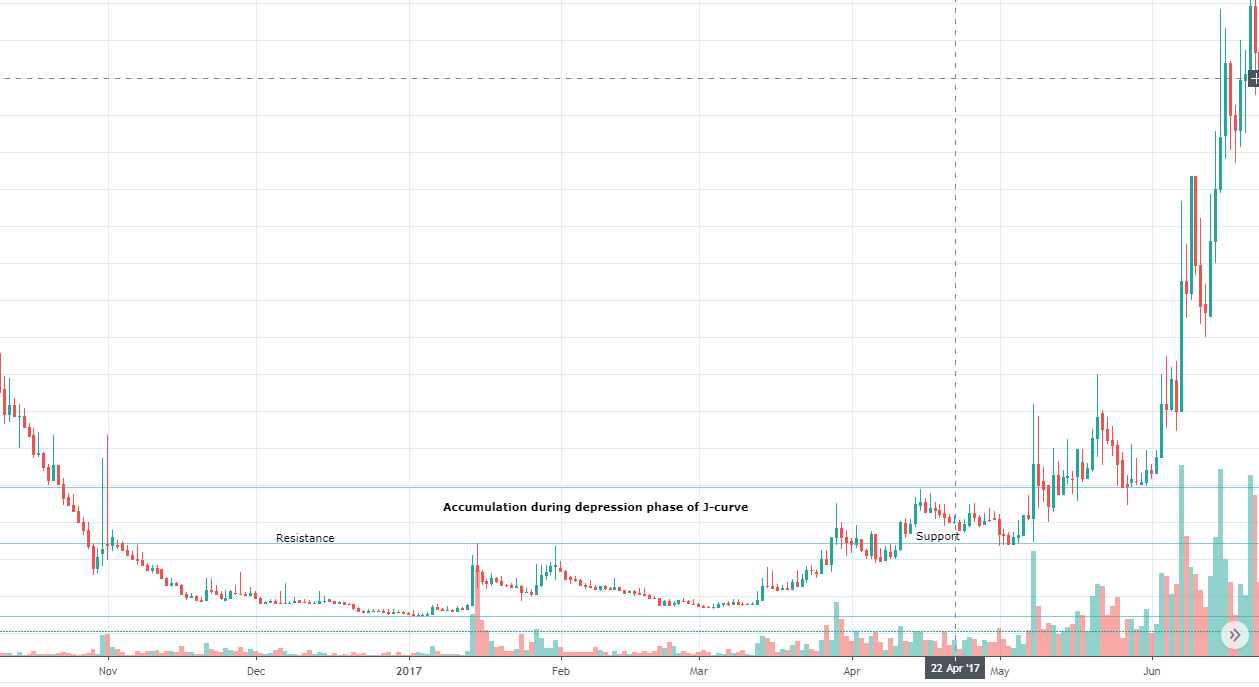
Bitcoin price action & the j-curve
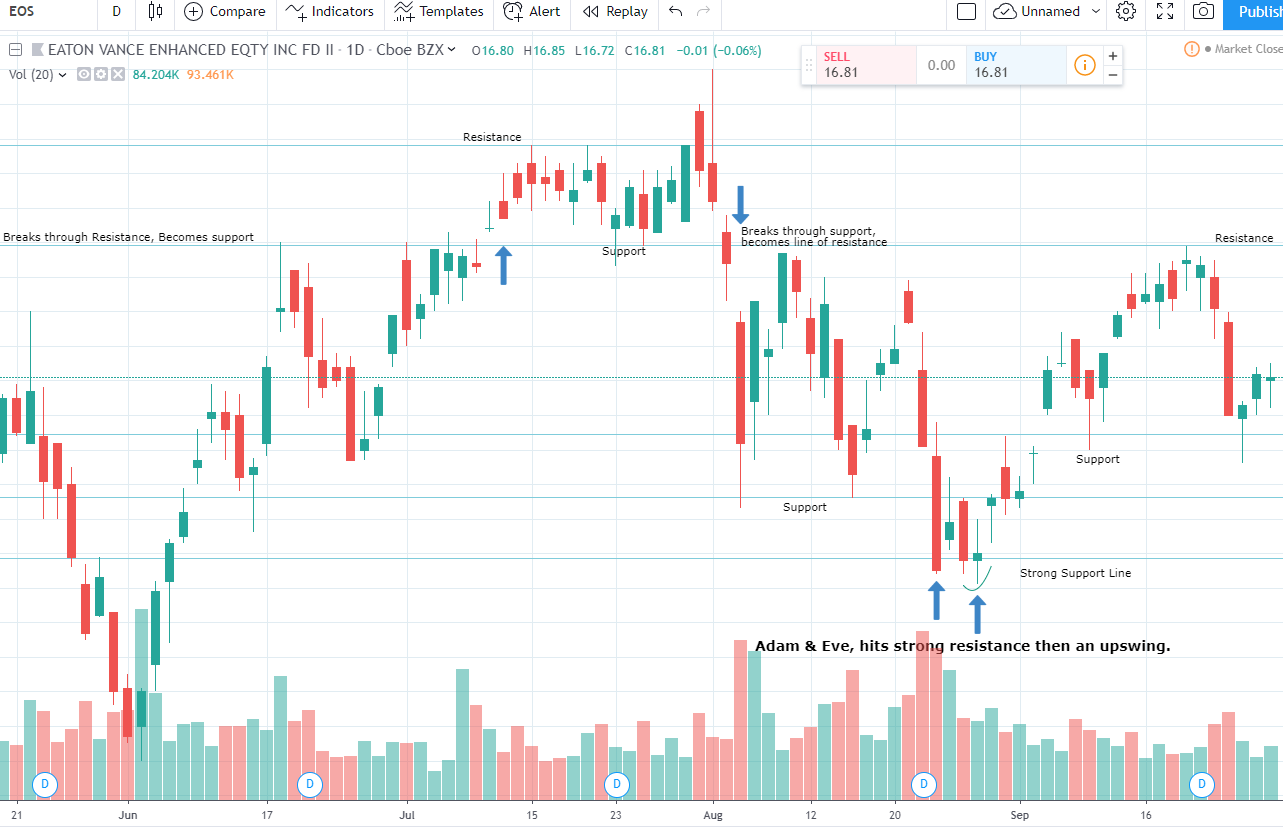
During the depression phase of the J-curve is when the smart money will quietly accumulate preparing for the next upswing. The following example shows price staying within a range, staying between support and resistance for close to 5 months then breaking out and making resistance support before the big upswing.
Its important to understand that market movers ie. smart money players can profit off of the "not so smart" money. I make sure that I'm not in this category by keeping on top of charts, patterns, fundamentals and thus opportunities to enter smart trades.
It takes work to familiarize yourself with patterns and learn the tools necessary to set yourself apart from the crowd and actually make money in this market! If trading isn't for you, the best way I have found is to find great coins, buy the dips and don't sell...

Recent Articles
-
Cryptocurrency is about to go mainstream, come find out why.
Feb 20, 22 11:33 AM
 Cryptocurrency about to explode, as big money starts to invest these prices won't stay low for long!
 -
Theta Network
Feb 19, 22 11:14 PM
Theta technology solves the internets slow transmission speeds through incentivized bandwidth sharing. -
CryptoWallet tips and tricks and keeping your Crypto safe.
May 31, 20 05:17 PM
 How to store your Coins in Crypto Wallet giving you peace of mind!